The Sales Quantity Analysis report module is used to generate a report that analyzes the total sales quantity for each product, broken down into various Units of Measure. This report is very useful for understanding sales volume from different logistics and packaging perspectives.
1. Report Parameters (Filter)
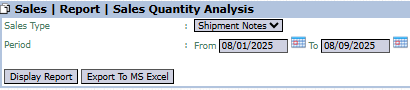
The main page of this module is a simple form containing several parameters to customize the report that will be generated.
Here is an explanation for each parameter:
Sales Type:
Use this dropdown to select the data basis that will be used for the analysis, for example, Shipment Notes (based on goods that have already been shipped).
Period:
Specify the From and To date range to define the period of transactions to be analyzed (e.g., 08/01/2025 to 08/09/2025).
2. Steps to Generate the Report
Step 1: Set Report Parameters
Select the Sales Type and define the Period range.
Step 2: Generate the Report
After all parameters are set, click one of the two buttons in the bottom-left section of the page:
Display Report: To preview the analysis report directly on your screen.
Export To MS Excel: To download the report data in an Excel file format.
3. Example of the Report View
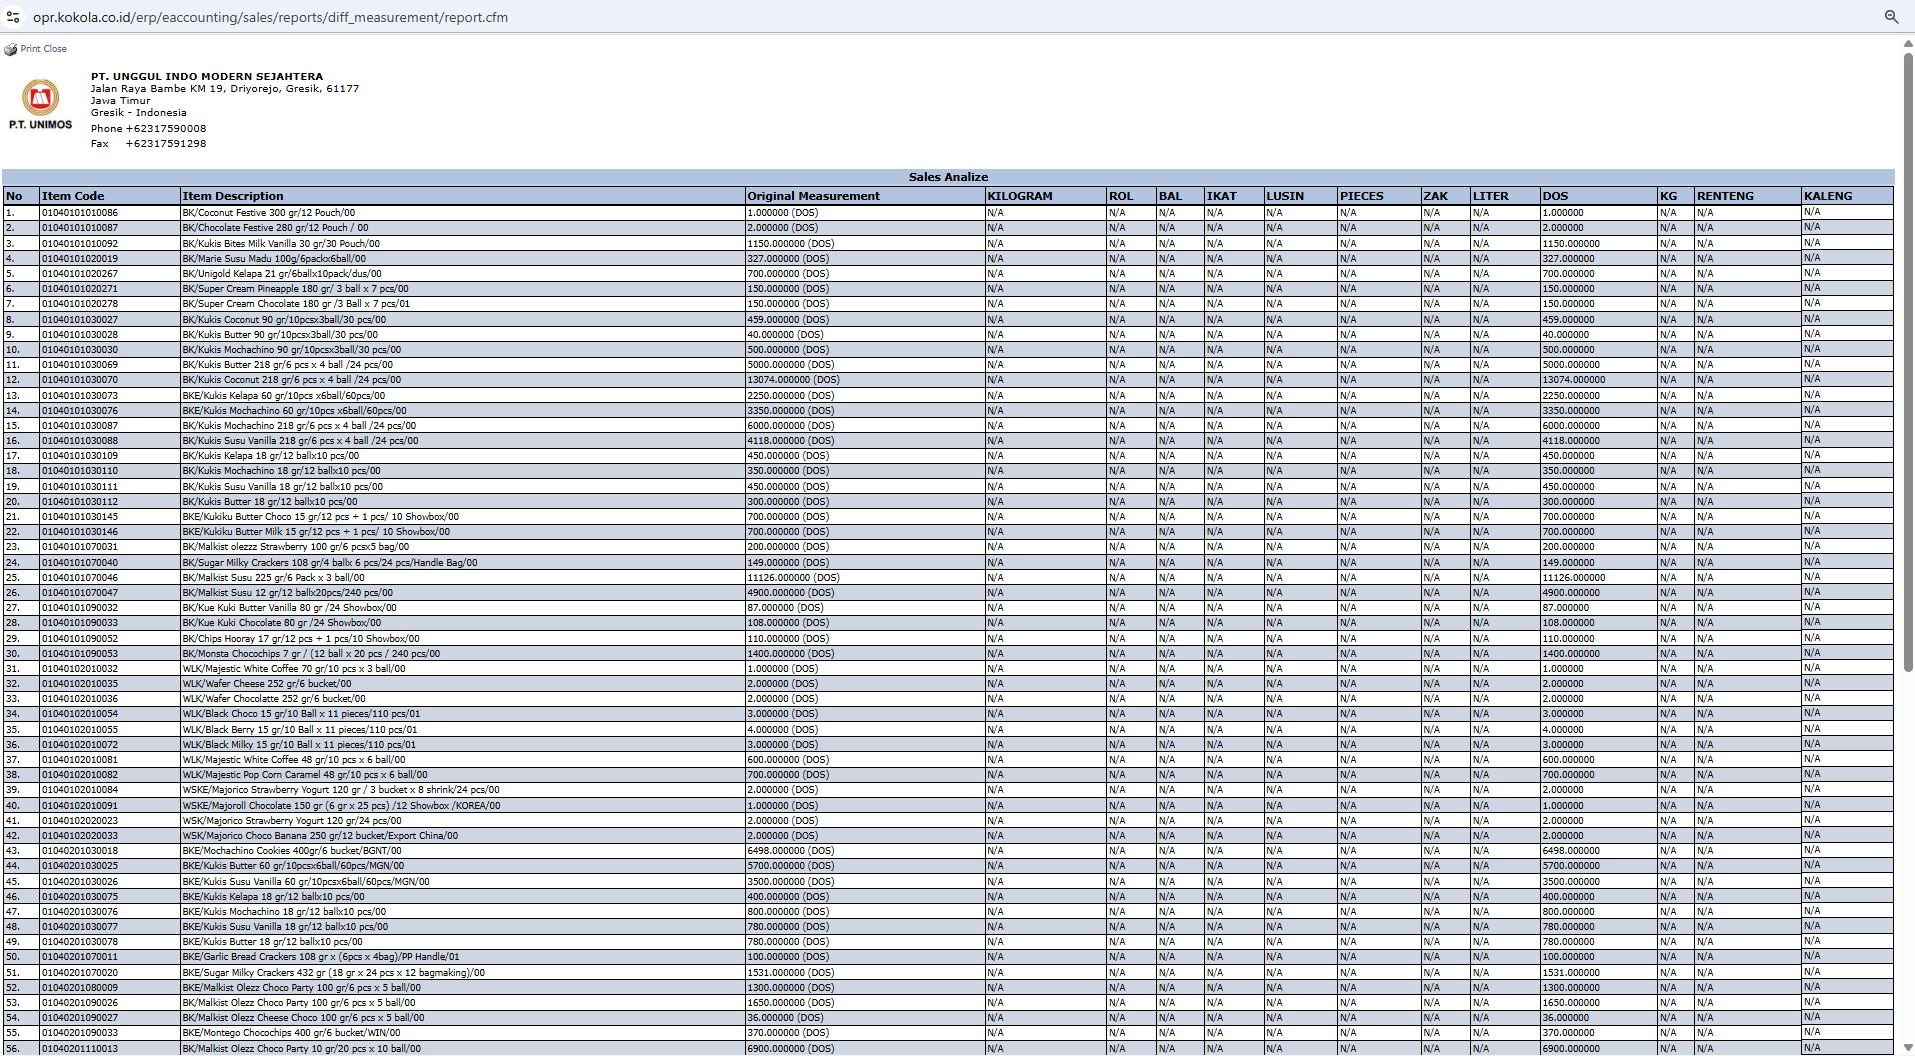
After you click, the system will generate a detailed report in a matrix format as follows:
Report Explanation: This report presents sales quantity data in a matrix format based on various units of measurement.
Rows: Display the Item Code and Item Description of the products sold.
Columns: Display the total sales quantity in various units, such as KILOGRAM, DOS (cartons), RENTENG (strips), and others.
Tips & Important Notes
Use this report to understand product sales volume in various units, which is useful for logistics, packaging, and production planning.
This report helps answer questions like, "How many total cartons (DOS) of product A were sold last month?".
To get accurate analysis results, ensure the unit conversion data in the product master data has been set up correctly.


No comments to display
No comments to display