The Sales Forecast report module is used to generate a highly detailed sales forecast report in a matrix format. This report presents daily sales forecast data for each product item and can be filtered by distributor and period, making it a critical input for production and inventory planning.
1. Report Parameters
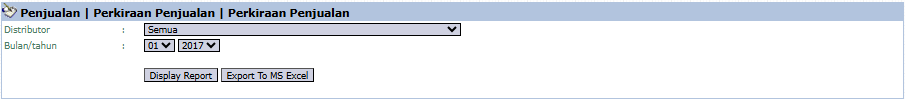
The main page of this module is a simple form containing several parameters to define the report that will be generated.
Here is an explanation for each parameter:
Distributor:
Use this dropdown to select the report's scope, whether for All distributors or for a specific distributor.
Month/Year:
Select the month and year of the forecast period you wish to view (e.g., 01 / 2017).
2. Steps to Generate the Report
Step 1: Set Report Parameters
Define the Distributor and Month/Year parameters according to the data you wish to see.
Step 2: Generate the Report
After the parameters are set, click one of the two buttons at the bottom:
Display Report: To preview the sales forecast report directly on your screen.
Export To MS Excel: To download the report data in an Excel file format.
3. Example of the Report View
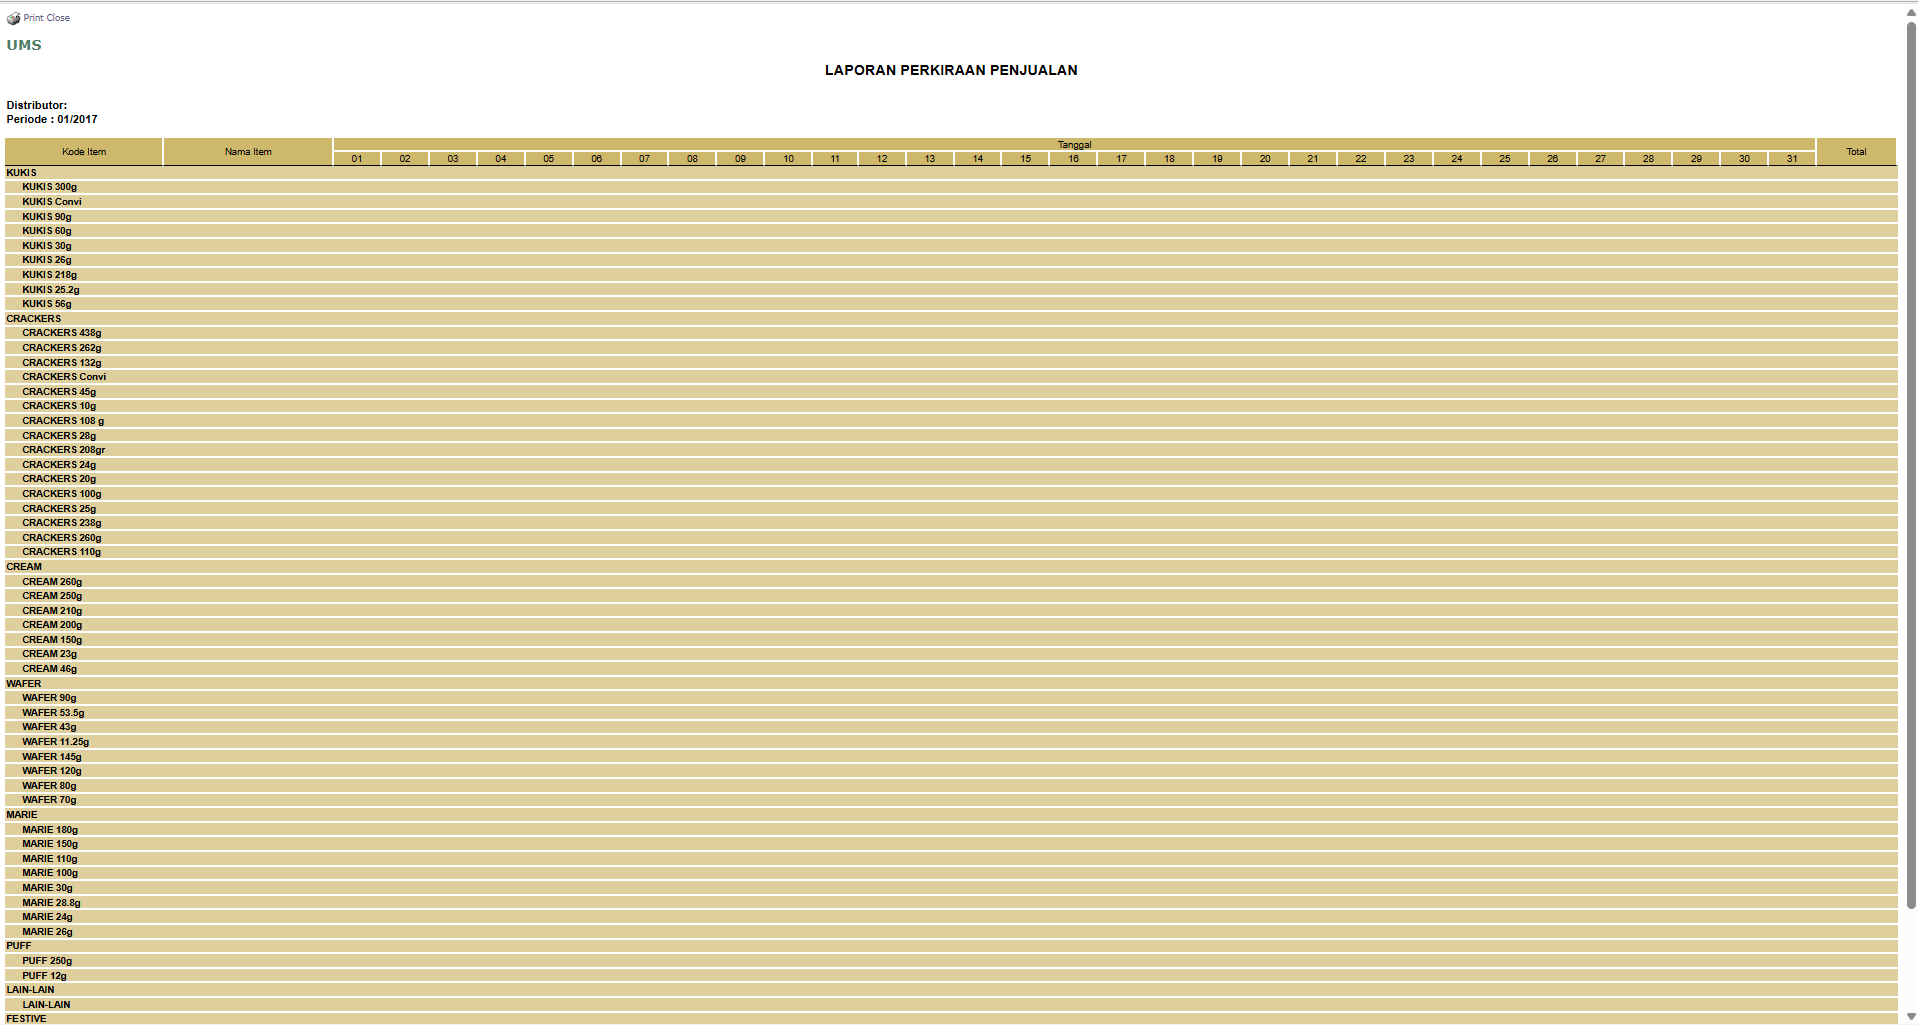
After you click, the system will generate a detailed report in a matrix format as follows:
Report Title: SALES FORECAST REPORT.
Rows: Show the Item Code and Item Name, grouped by product category (KUKIS, CRACKERS, CREAM, etc.).
Columns: Show the Dates of the month, from the 1st to the 31st, with a Total column at the end.
Data Cells: Each cell will contain the forecast sales quantity for a specific item on a specific date.
Tips & Important Notes
This report provides a very detailed view down to the daily level, which is very useful for the PPIC (Production Planning and Inventory Control) team to plan the production schedule.
To ensure the displayed data is accurate, make sure the forecast data from distributors has been uploaded via the Upload Data Forecast module before running this report.


No comments to display
No comments to display