Sale Analysis
Sales Reports
This section covers various types of reports that can be generated from sales data for analysis and monitoring purposes.
Report Module Guide: Sales Analysis
Module Location
Sales > Reports > Sales Analysis
Module Objective
The Sales Analysis module is a very powerful business analysis tool. Its purpose is to generate a detailed report that not only displays sales data but also calculates the profitability or Margin for each transaction line. This report compares sales revenue with the Cost of Goods Sold (COGS) to provide deep insights into product and customer performance.
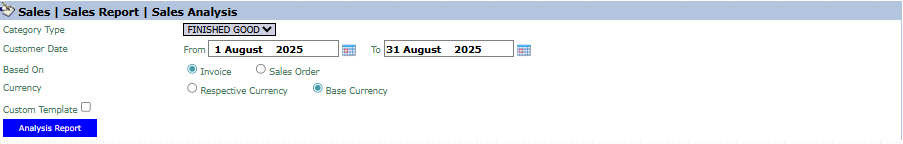
1. Report Parameters (Filter)
The main page of this module is a form containing several parameters to define the scope of the analysis.
Here is an explanation for each parameter:
-
Category Type:
-
Select the product category you want to analyze (e.g., FINISHED GOOD).
-
-
Customer Date:
-
Specify the From and To date range to define the analysis period (e.g., August 1, 2025, to August 31, 2025).
-
-
Based On:
-
Choose the data basis for the analysis:
-
Invoice: Analysis based on invoices that have already been issued (finalized sales).
-
Sales Order: Analysis based on confirmed sales orders.
-
-
Currency:
-
Choose how currency values will be displayed: Respective Currency or Base Currency.
-
2. Steps to Generate the Report
Step 1: Set Report Parameters
Select all the parameters you need, especially defining the date range and the analysis basis (Invoice or Sales Order).

Step 2: Generate the Report
After all parameters are set, click the Analysis Report button in the bottom-left section of the page to generate the detailed report.
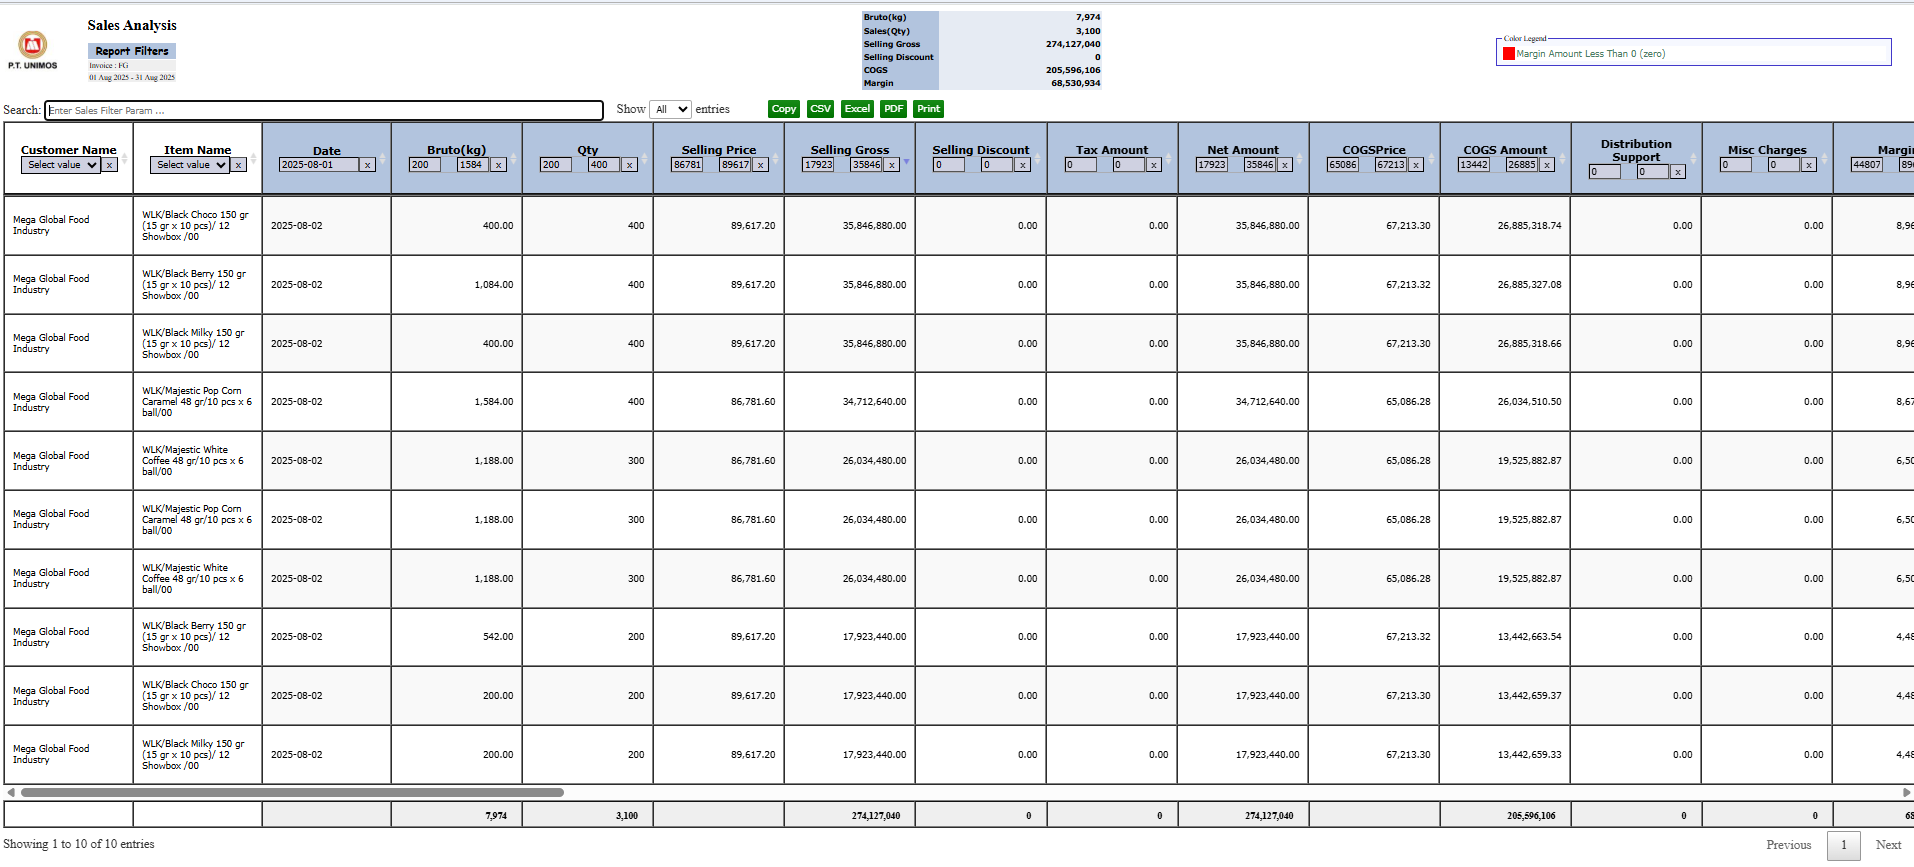
3. Reading the Sales Analysis Report
The generated report will display a highly detailed data matrix.
-
Summary (Header): The top section of the report displays a summary of totals such as Net Sales and Margin.
-
Detail Columns: The main table displays a breakdown per transaction line, with these key columns:
-
Selling Gross: The gross sales value (Qty x Selling Price).
-
Net Amount: The net sales value after discounts.
-
COGS Amount: The Cost of Goods Sold value for the items sold.
-
Margin: The gross profit generated from the transaction (Net Amount - COGS Amount).
-
-
Report Features: This report is interactive, equipped with internal filters and export buttons for various formats like CSV, Excel, and PDF.
Tips & Important Notes
-
This report is a very powerful profitability analysis tool. Use it to identify which products or customers are the most profitable.
-
Selecting Based On 'Invoice' provides a picture of profitability from finalized sales, whereas 'Sales Order' provides an estimated profitability of incoming orders.
-
To get a valid Margin value, ensure that the Cost of Goods Sold (COGS) data is accurate in the system.
No comments to display
No comments to display