The Sales Forecast Report module is used to generate an analytical report that summarizes sales forecast data and compares it with historical data as well as other operational data. This report provides a high-level view for the Sales and Operations Planning (S&OP) process.
1. Report Parameters
The main page of this module is a simple form containing a date parameter for the report.
Here is an explanation for each parameter:
Sales Forecast Period:
Specify the From and To date range to define the report period you wish to analyze (e.g., August 1, 2025, to August 31, 2025).
2. Steps to Generate the Report
Step 1: Set Report Parameters
Define the date range in the Sales Forecast Period fields.
Step 2: Generate the Report
After the parameters are set, click one of the two buttons at the bottom:
Display Report: To preview the report directly on your screen.
Export To MS Excel: To download the report data in an Excel file format.
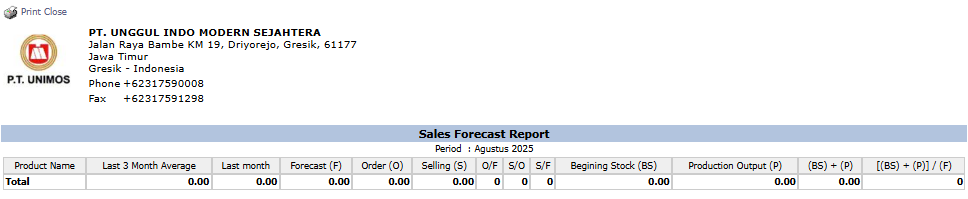
3. Example of the Report View
After you click, the system will generate a detailed report like the following, which summarizes and analyzes the forecast data.
Report Explanation: This report displays a comparison between historical sales data, the forecast, and other operational data for each product.
Key Columns:
Product Name: The name of the product being analyzed.
Last 3 Month Average: The average sales of the last 3 months.
Last month: The previous month's sales data.
Forecast (F): The sales forecast quantity for the selected period.
Order (O): The quantity of incoming Sales Orders.
Selling (S): The quantity of actual sales (from invoices).
Beginning Stock (BS): The beginning stock for the period.
Production Output (P): The quantity of production output.
Calculation Columns: The columns on the right ([BS] + (P), [(BS) + (P)] / (F)) are calculations used for S&OP analysis, such as calculating coverage days.
Tips & Important Notes
This report is a crucial strategic analysis tool for Management, the Sales team, and the PPIC team.
Use this report in monthly S&OP meetings to align sales plans, production capabilities, and inventory levels.
To get an accurate analysis, ensure the forecast data has been uploaded and approved, and that all sales and production transaction data has been entered correctly.


No comments to display
No comments to display