The SKU Sales Performance Report module is used to generate a highly in-depth profitability analysis report at the individual product level (SKU - Stock Keeping Unit). This report not only displays sales data but also takes into account the Cost of Goods Sold (COGS), returns, and various promotional costs to calculate the final profit from each product.
1. Report Parameters (Filter)
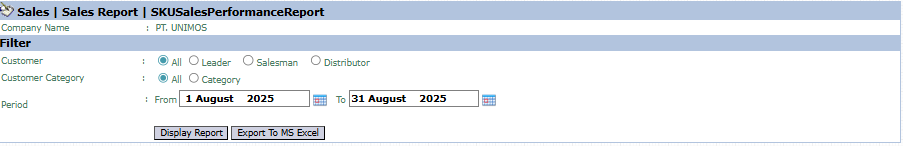
The main page of this module is a form containing various parameters to customize the report that will be generated.
Here is an explanation for each parameter:
Customer / Customer Category:
Filter data by the customer scope, whether All, by Leader, Salesman, Distributor, or by Category (Customer Category).
Period:
Specify the From and To date range to define the analysis period (e.g., August 1, 2025, to August 31, 2025).
2. Steps to Generate the Report
Step 1: Set Report Parameters
Select all the parameters you need, especially defining the Period range.
Step 2: Generate the Report
After all parameters are set, click one of the two buttons in the bottom-left section of the page:
Display Report: To preview the SKU performance report directly on your screen.
Export To MS Excel: To download the report data in an Excel file format.
3. Example of the Report View
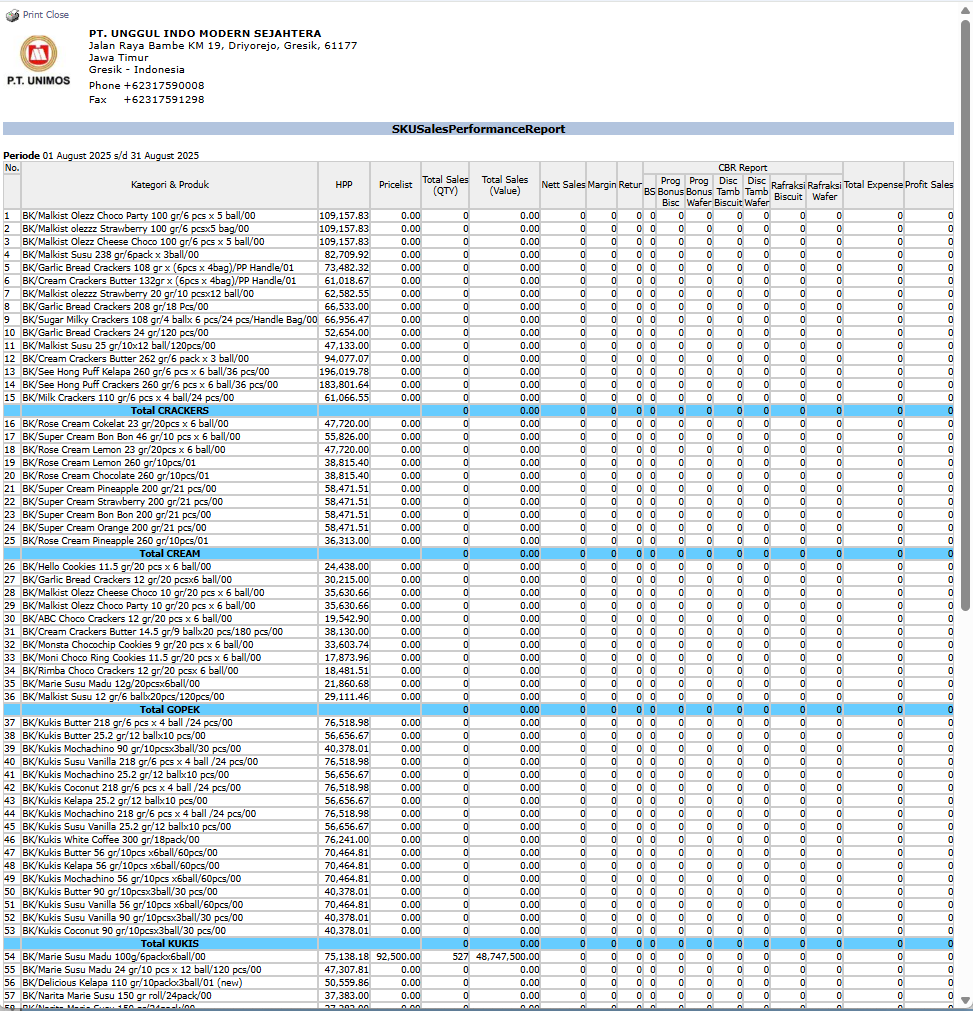
After you click, the system will generate a detailed report like the following, which provides a complete profitability analysis per product.
Report Explanation: This report presents a very in-depth profitability analysis for each product, grouped by category (CRACKERS, CREAM, KUKIS, etc.).
Key Columns for Analysis:
Total Sales (Value): Total gross revenue from the sale of the product.
Nett Sales: Net revenue after deducting returns or direct discounts.
HPP: The Cost of Goods Sold for the product.
CBR Report: This section details various promotional costs and discounts allocated to the product, such as Prog Disc, BS/Bonus, Refractions, etc.
Total Expense: The total of all recorded promotional costs.
Profit Sales: The final profit generated by each product, calculated after deducting HPP and all related costs from net sales.
Tips & Important Notes
Use this report to identify which products are the most and least profitable on a net profit basis, after taking all related costs into account.
This report is crucial for Product Managers and Management to make strategic decisions regarding the product portfolio, pricing, and the allocation of the promotional budget.
The accuracy of this report is highly dependent on the accuracy of the HPP (COGS) data and the discipline in allocating all promotional costs to each sales transaction.


No comments to display
No comments to display