The Distributor Sales Return Report module is used to generate an analytical report that calculates the return rate or percentage for a distributor. This report compares the total sales value (turnover) with the total value of returned goods to provide an overview of the distributor's performance and potential product issues in the market.
1. Report Parameters (Filter)
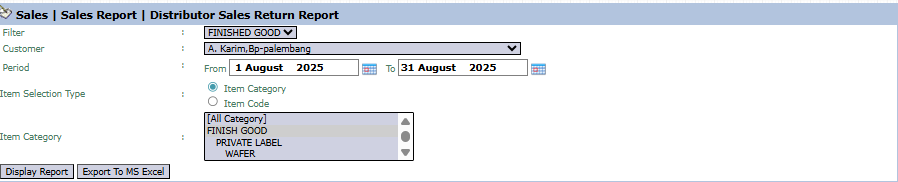
The main page of this module is a form containing various parameters to customize the report that will be generated.
Here is an explanation for each parameter:
Customer:
The primary filter to select the Distributor to be analyzed from the dropdown (e.g., A. Karim,Bp-palembang).
Period:
Specify the From and To date range to pull sales and return data within that period (e.g., August 1, 2025, to August 31, 2025).
Item Category:
Use this list box to focus the analysis on specific product categories.
2. Steps to Generate the Report
Step 1: Set Report Parameters
Select the Customer (Distributor) you wish to analyze and define the Period range.
Step 2: Generate the Report
After all parameters are set, click one of the two buttons in the bottom-left section of the page:
Display Report: To preview the analysis report directly on your screen.
Export To MS Excel: To download the report data in an Excel file format.
3. Example of the Report View
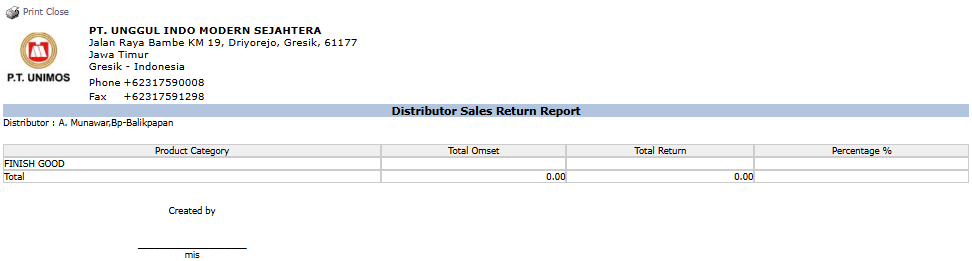
After you click, the system will generate a summary report like the following.
Report Explanation: This report presents a summary of the return rate per Product Category for the selected distributor.
Key Columns for Analysis:
Total Omset (Total Turnover): Shows the total sales value to the distributor in that period.
Total Return: Shows the total value of goods returned by the distributor.
Percentage %: Shows the return percentage, calculated from (Total Return / Total Turnover) x 100%.
Tips & Important Notes
Use this report to evaluate distributor performance. A high return rate may indicate problems with sales activities, product handling, or logistics at the distributor level.
This report is an important analysis tool for Sales Management to manage distributor relationships and performance.
To get an accurate percentage calculation, ensure all sales and return transactions for that distributor have been recorded correctly in the system.


No comments to display
No comments to display