
AGP
AGP (Achievement, Growth & Progress) Module Guide
Module Location:
soApp > AGP
The Achievement, Growth & Progress (AGP) module is used to monitor sales achievements and growth over a given period. The information displayed includes a comparison of Sales Targets and Sales Achievements, MTD and YTD achievement percentages, and sales growth based on Value and Quantity.
-
Tampilan Utama AGP
The Achievement, Growth & Progress (AGP) page displays sales performance information in the form of charts, percentages, and tables. In general, the AGP page is divided into two main sections:
- Sales target vs Sales Achievement
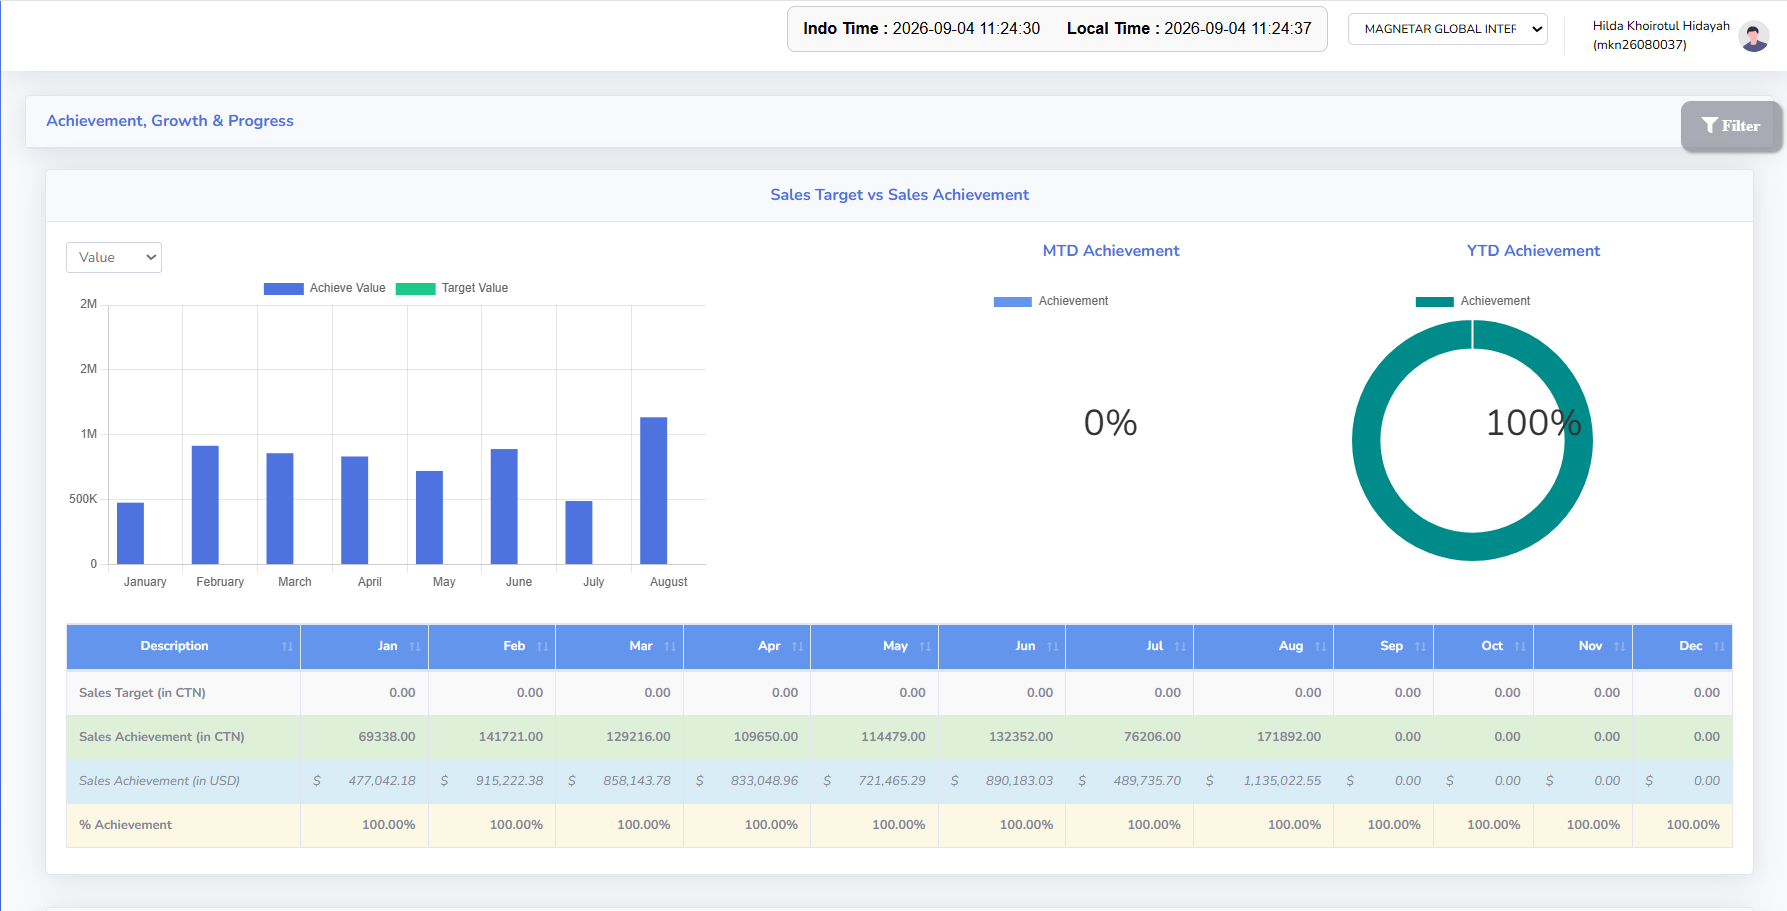
Sales Target vs. Sales Achievement is used to compare sales targets with recorded sales achievements. The information is displayed in the following formats:
-
Sales Target and Sales Achievement Charts, showing a comparison between sales target values and actual sales results for each month.
-
MTD Achievement, showing the percentage of sales achieved for the current month.
- YTD Achievement, showing the cumulative sales achievement percentage for the current year.
-
A table of monthly sales achievements, showing details of sales targets and achievements from January through December.
-
- Sales Growth
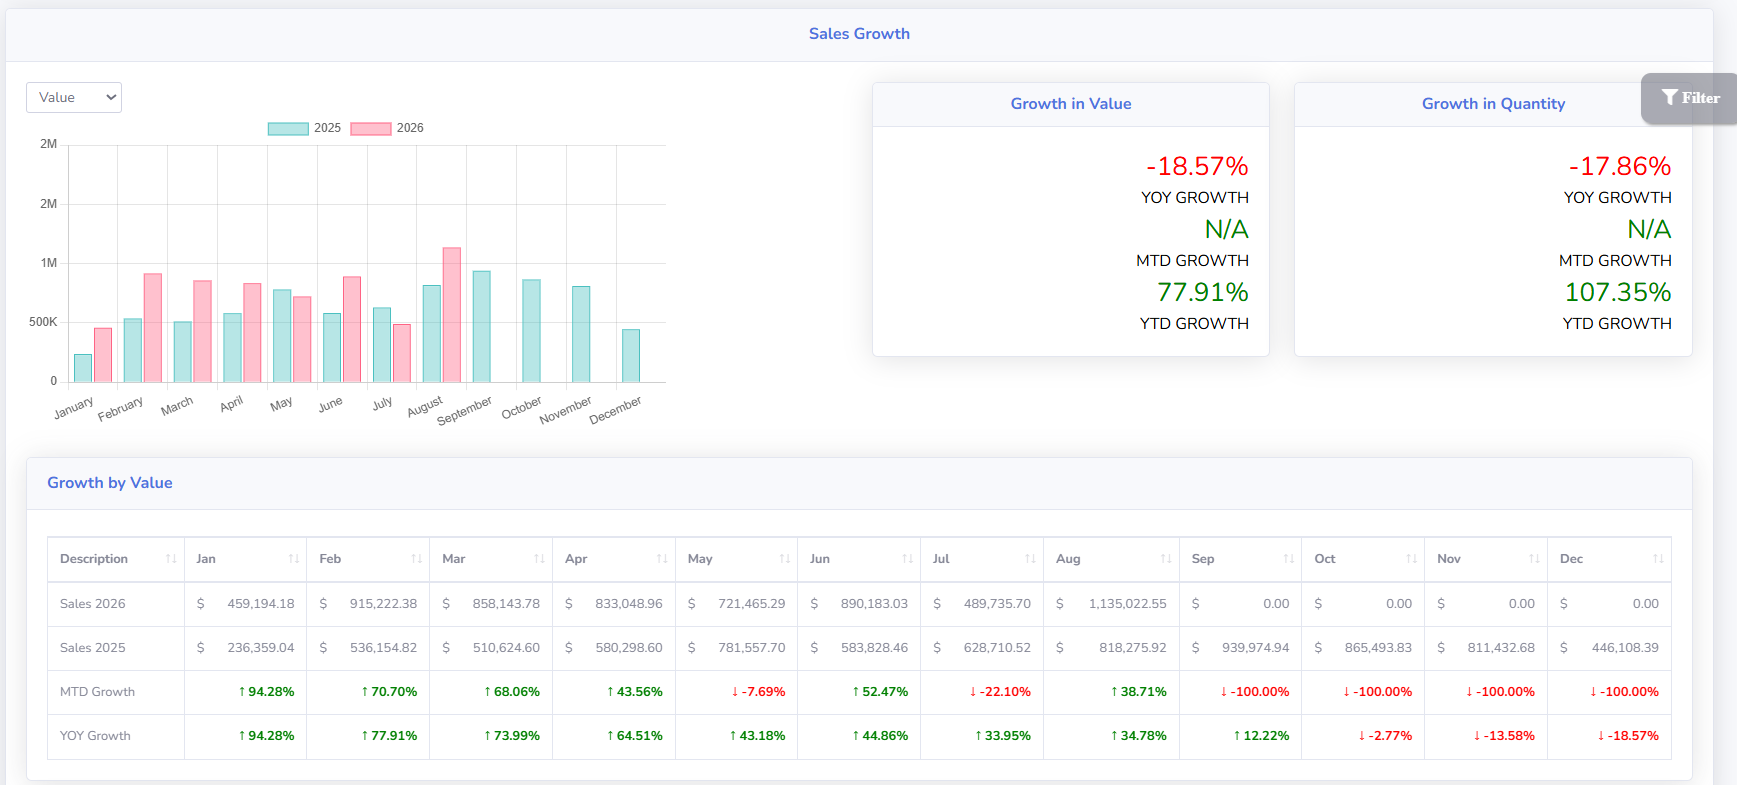
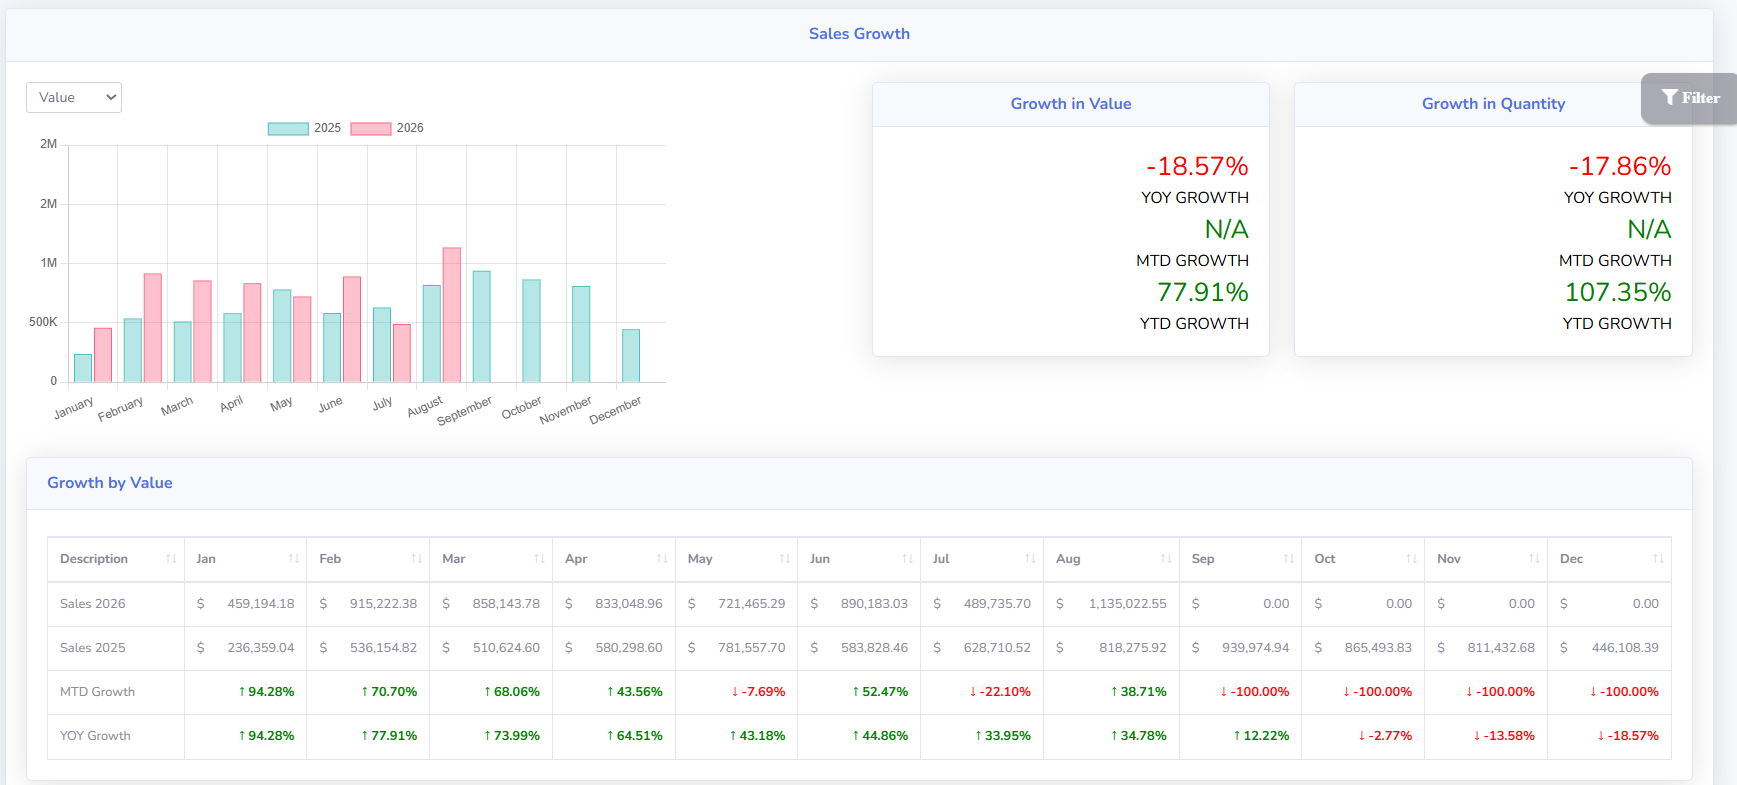
Sales Growth is used to track sales trends and growth by comparing data from two annual periods. The Sales Growth chart displays a comparison of monthly sales between the current year and the comparison year. The information is presented in the following format:
-
Growth in Value Chart
Growth in Value displays the percentage growth in sales based on sales value. This section includes three indicators:
-
YOY GROWTH: YoY (Year-over-Year) is used to compare the performance of a given period with the corresponding period in the previous year.
-
MTD GROWTH: Displays growth based on the current month being calculated.
-
YTD GROWTH: Displays the cumulative growth percentage from the beginning of the year up to the period currently being calculated.
-
-
-
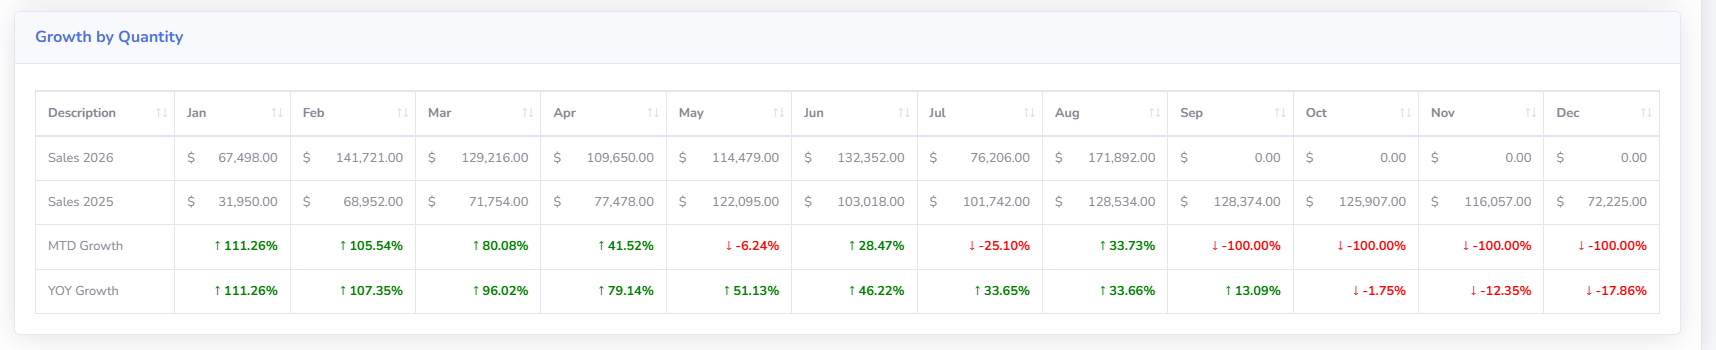
Growth in Quantity Chart
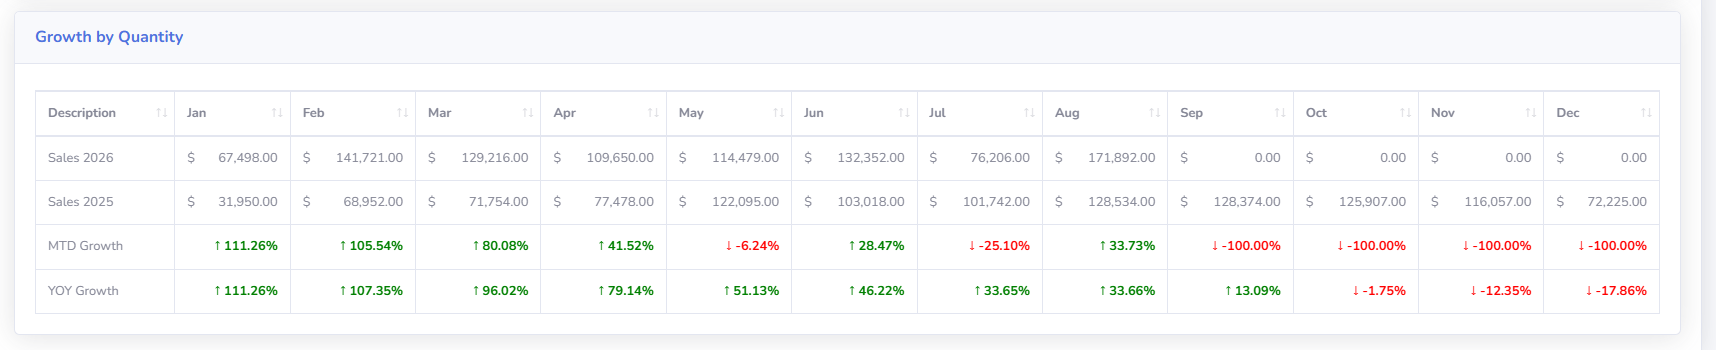
Growth in Quantity shows the percentage growth in sales based on the quantity of products. Just like Growth in Value, this section displays:
-
YOY Growth
- MTD Growth
-
YTD Growth
-
-
The difference is:
“Growth in Value” = based on sales value
“Growth in Quantity” chart = based on the number of products sold
- Sales target vs Sales Achievement
-
Tips & Important Notes
-
Use the Filter to display data based on the desired region and time period.
-
Compare Sales Target with Sales Achievement to track progress toward sales targets.
-
Check the MTD Achievement to see performance for the current month.
-
Check the YTD Achievement to see cumulative performance for the current year.
-
Use Growth in Value to view growth based on sales value.
-
Use Growth in Quantity to view growth based on product quantity.
-
Pay attention to the green and red indicators in the Growth table to identify increases or decreases.
-
Compare data from the current year and the previous year to see sales trends.
-
No comments to display
No comments to display